Visual Management
Visual management incorporates the use of visuals (charts, graphs, tables, pictures) to tell the story of what is happening in the various departments, as well as the whole site.
It helps to pinpoint any instances that are not normal, in which action items can be created to correct these abnormalities.
Key Performance Indicators (KPI's):
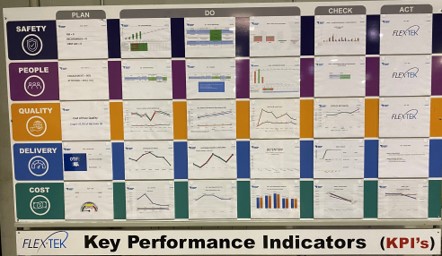
We utilize what we call KPI Boards (Key Performance Indicators). These boards are used to post specific metrics (ex. Safety, People, Quality, Delivery, Cost as shown above). These metrics help us manage our day-to-day operations. The KPI boards help us see these changes monthly, which in turn help us to make decisions on how to manage the departments to overcome some of the abnormalities seen on the KPI board.